Safex Mining Innovative Currency Distribution Algorithm: The S-Curve
Diffusion of Innovation Theory is the driving force behind the equitable distribution of the Safex Cryptocurrency via Proof of Work mining.


Diffusion of Innovation Theory is the driving force behind the equitable distribution of the Safex Cryptocurrency via Proof of Work mining. This article will dive into concepts that define the Safex Cash emission schedule as well as rate and compare it to other already known cryptocurrencies.
Introduction
In order to have a truly decentralized peer-to-peer marketplace protocol - based on a proof of work mining algorithm - the wide distribution of currency (medium of exchange) and mining power (security of the protocol) is highly relevant. To achieve this, it is important to have an emission curve that follows the adoption of the currency. [1]
Diffusion of Innovation Theory
The diffusion of innovation (DOI) theory was originally developed by E.M. Rogers in 1962. It proposes that an idea or product becomes adopted naturally within time in a specific way. In this scenario, five different types of adopters make up the total population of adoption:
- Innovators: This small group wants to be the first to try the innovation. They are very curious, willing to take a risk, and may also be involved in the development of the innovation itself.
- Early Adopters: This bigger group represents opinion leaders. They enjoy leadership roles and are comfortable adopting new ideas. Innovators can attract this group with information about the innovation.
- Early Majority: This even bigger group is made up by people who are not leaders but yet adopt new ideas before the average person. They will only join the adoption as they have seen evidence that the innovation works.
- Late Majority: This group is as big as the early majority group and will only try the innovation after it has been adopted by the majority of the population. This group is generally skeptical of change.
- Laggards: This smaller last group is made up by very conservative people. They are very skeptical of change and the hardest to convince of the innovation's benefits and success. [2]
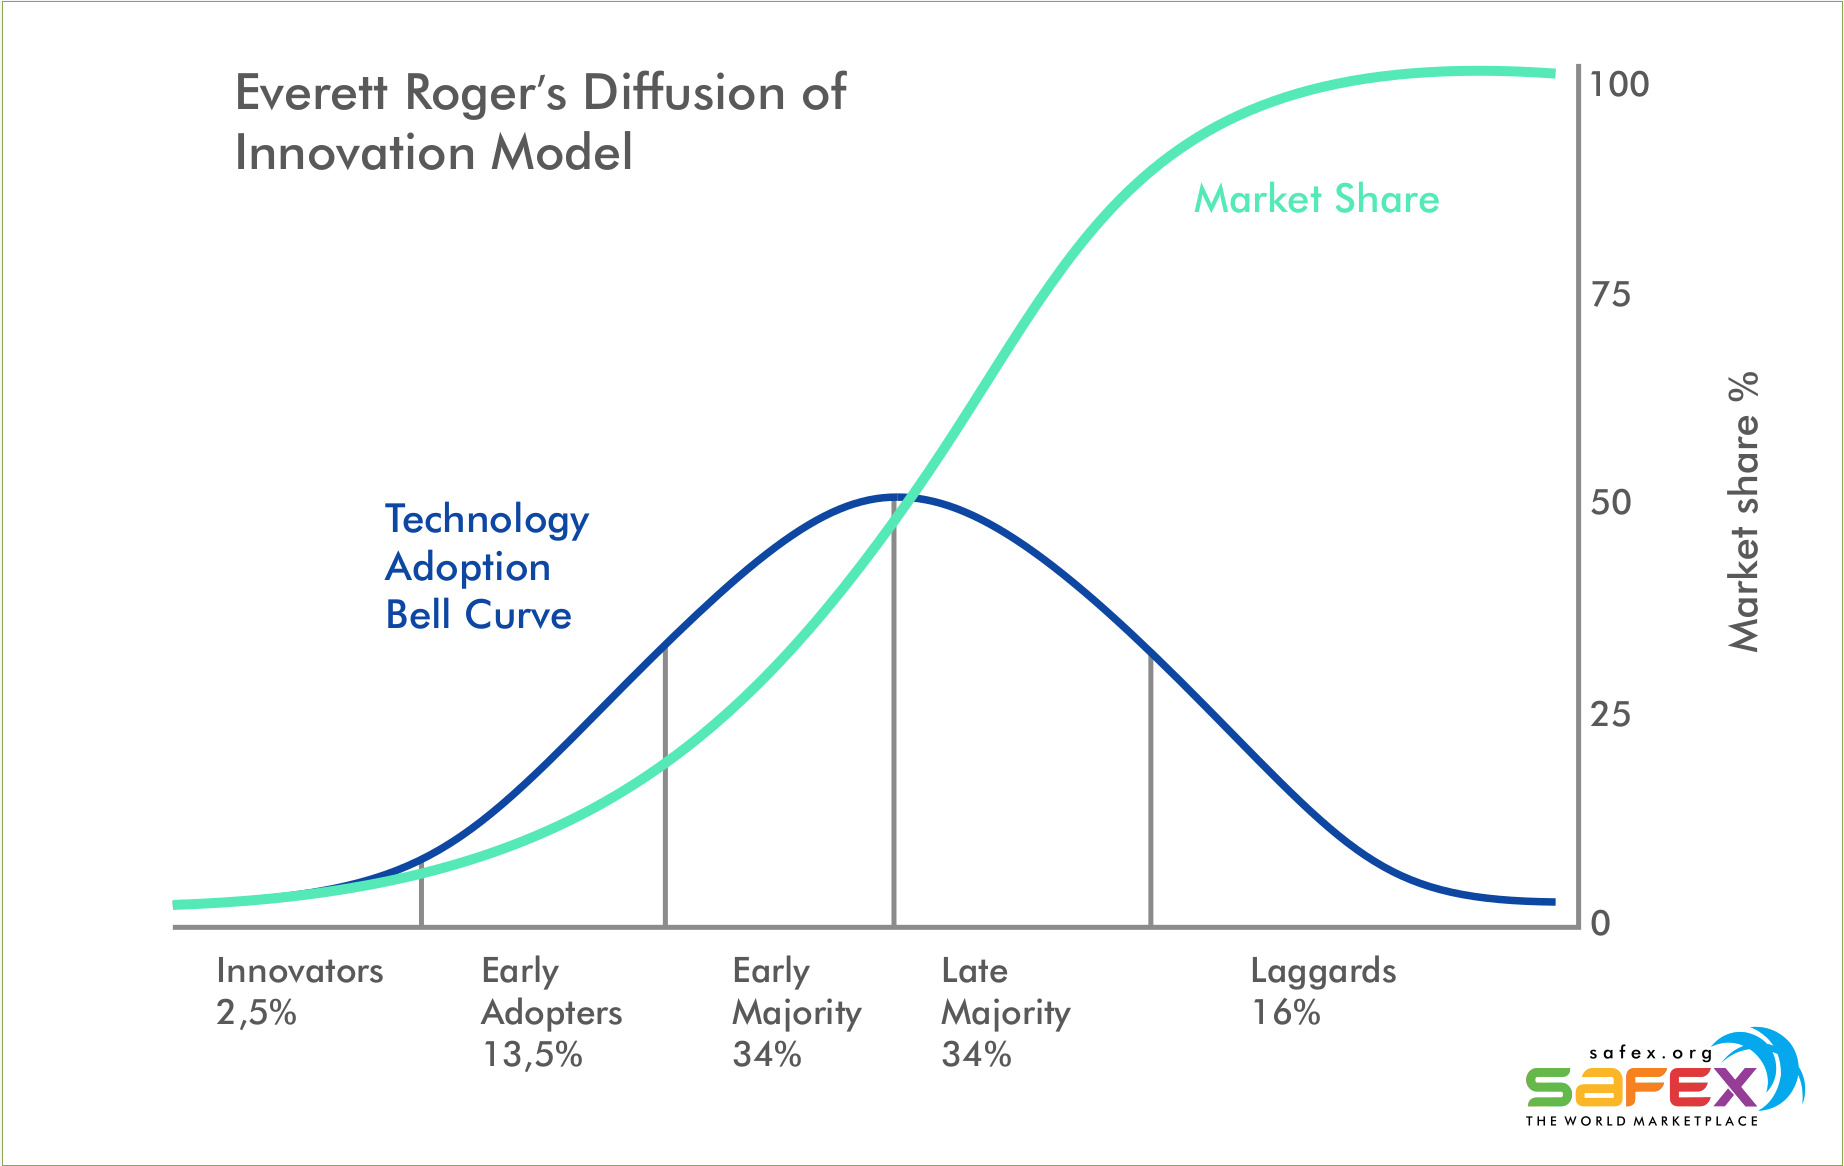
The different stages of adoption as well as the total adoption based on the diffusion of innovation model is illustrated by two specific curves in the graph shown below.
The adoption rate (new adopters per time interval) is depicted as a bell shaped curve (blue). It can be seen that the adoption gradually accelerates beginning with the innovators until the last early majority adopters. After these groups have adopted the innovation, the adoption rate - now made up by late majority and laggards - decelerates again.
The cumulative adoption (sum of all adopters) of the population is depicted as an S-shaped (sigmoid) curve (green). The cumulative adoption is a function of the adoption rate. Therefore, this curve can be calculated based on an estimation of the different stages of adoption (percentages of the five adopter groups and their adoption time intervals).
Historical Adoption Rates of Innovations
When deciding for the parameters that the coin emission should have (increase and decrease of block rewards, time interval between genesis block and first tail emission block), historical adoption rates of innovations can be examined for reference. The graph below depicts US adoption rates of different inventions.
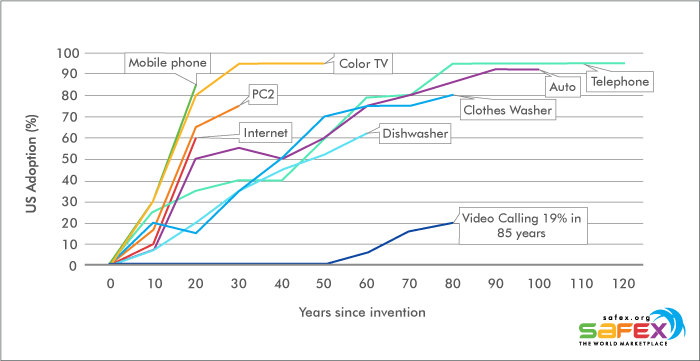
It can be seen that newer inventions are being adopted at a higher rate than older inventions have been adopted. According to the graph, the telephone's 80% adoption ratio took 60 years from its invention. In contrast to this, the mobile phone's 80% adoption rate took less than 20 years. [3]
Based on this development of adoption rates within time it can be assumed that today's innovations will be majorly (>80%) adopted after 20 years or even less.
Monetary Base of Safex Cash (SFX)
Now, in order to align the distribution of currency with the population's adoption of the currency, the emission schedule should mirror or at least be somewhat alike the adoption rate. The graph below illustrates the historical and prospective development of Safex Cash's (SFX) monetary base.
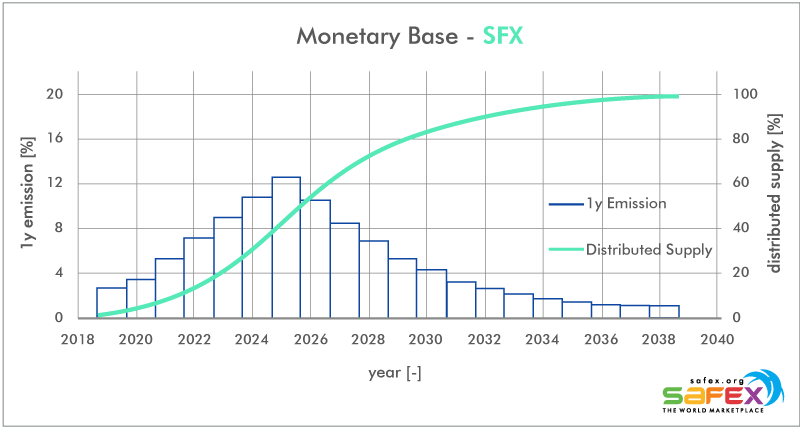
The blue bars give the emission of currency in each one year interval after the genesis block of the protocol. The bars resemble a distribution that looks alike the adoption rate in the diffusion of innovation model. The green curve gives the cumulative sum of the yearly emissions of the currency. It represents a sigmoid function (S-shaped curve) and mirrors the progress of total adoption in the diffusion of innovation model. Based on the emission schedule of Safex Cash, half (> 50%) of the population - the total final user base of the innovation - is expected to have adopted the innovation somewhere in 2025 (7 years after the genesis block) and the majority (>80%) somewhere in 2029 (11 years after the genesis block). The regular emission schedule will turn into a tail emission 20 years after the genesis block. Therefore, it is assumed that this innovation is adopted by 100% of the total final user base within this time interval. Now, the monetary base histories of other cryptocurrencies can be examined for comparison.
Monetary Base of Bitcoin (BTC)
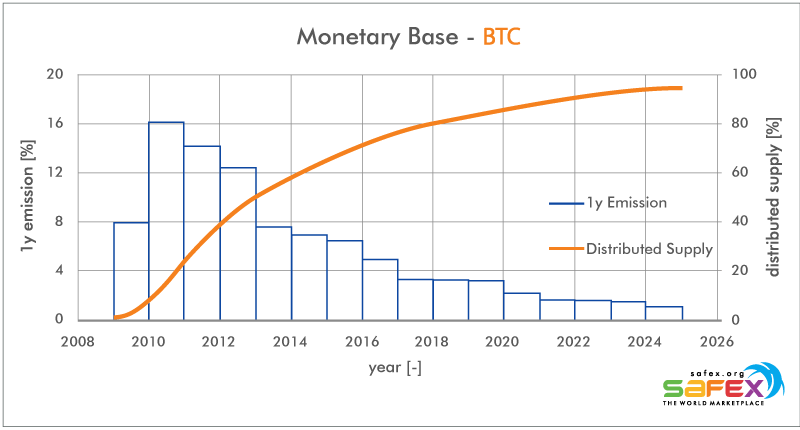
Bitcoin has got an emission schedule in which the block rewards halves every four years. 50% of the total supply are in circulation after this first four year cycle. It can be seen that the emission schedule does not align that well with the diffusion of innovation model.
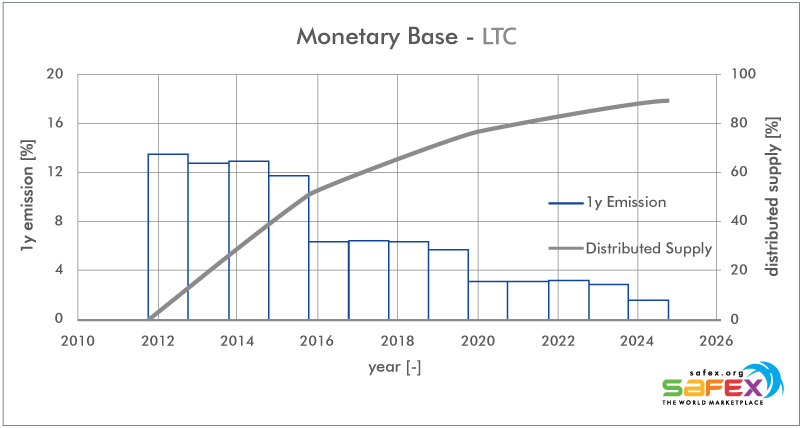
Monetary Base of Litecoin (LTC)
Litecoin has got the same emission schedule as Bitcoin - a halving of block rewards every four years until the maximum supply is in circulation. Therefore, the graph for its monetary base history is very similar to the one for Bitcoin. The graphs are not exactly the same because of fluctuating mining efforts and block times.
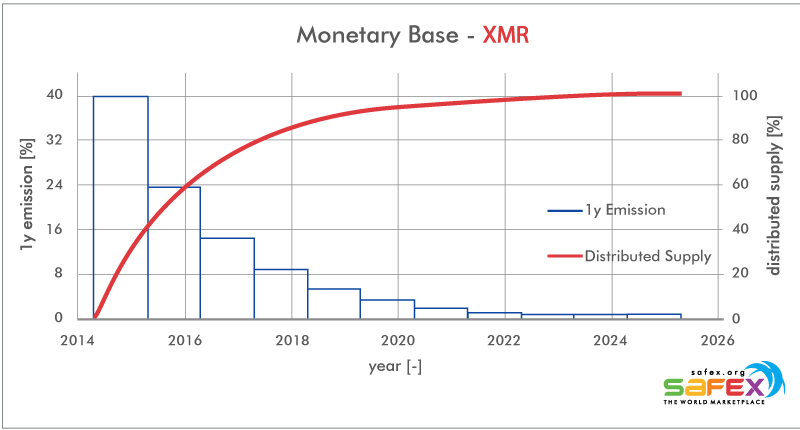
Monetary Base of Monero (XMR)
Monero's emission schedule is different to the one of Bitcoin and Litecoin. It does not have exact block reward halvings every four years but the emission rate has been consistently decreasing from its maximum since the genesis block. It can be seen that the yearly emitted coins and the total circulating supply are far off the resemblance of a diffusion of innovation model.
Monetary Base - Comparison
Now, all the examined cryptocurrencies' monetary base histories can be displayed in one combined chart. It can be seen how the genesis blocks of Bitcoin, Litecoin, Monero and Safex Cash were mined in their historical order.
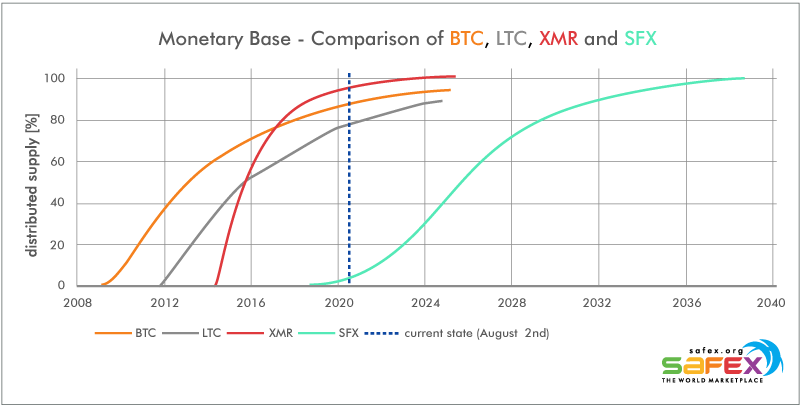
The vertical dashed blue line highlights the current state in time. Now, we can see the possible misalignment of currency distribution and currency adoption for each selected currency. The vast majority (>75%) of Bitcoin's, Litecoin's and Monero's supply is already in circulation. However, we can assume that we are not in this phase of innovation adoption - >75% adoption progress - for these currencies yet. Therefore, these currencies can be assumed to have been majorly distributed among innovators and early adopters. In contrast to this, only a minor percentage of Safex Cash's total supply is already in circulation.
Now, one could argue that this is not only because of the different emission schedules but also because of the different ages of the cryptocurrencies (different time intervals since the genesis blocks), which is partly true. However, we can align the genesis blocks and simulate a coincident launch of each cryptocurrency. The reference cryptocurrency in this case is Safex Cash.
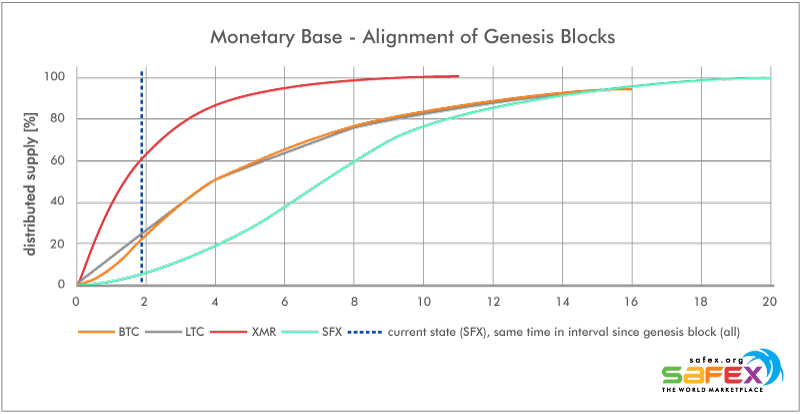
Now, we can compare how the distribution of cryptocurrencies would look like if all of them had been launched at the same date - the day of Safex Cash's genesis block. We can see that 60% of Monero's supply would have been already mined until today - more than 20% in case of Bitcoin and Litecoin. In contrast to this, approximately 5.6% of Safex Cash's total supply is circulating today (August 2, 2020). Now, if we imagine to go further along the time horizon - shifting the vertical dashed blue line to the right - we can see the different accelerations of circulating supply growth. Monero's circulating supply growth has got the highest acceleration followed by Bitcoin and Litecoin. Safex Cash's circulating supply growth accelerates the lowest in this comparison. As a result, Safex Cash's emission schedule gives adopters the most time to join the innovation and earn a fair share of the total supply via mining, followed by Bitcoin, Litecoin and Monero.
Note: In case of Safex Cash and Monero the percentage of distributed supply is based on the circulating supply before tail emission starts - this value is defined as 100% distributed supply in the graphs. Safex Cash's yearly tail emission will be 0.079% of its base value, whereas Monero's yearly tail emission will be 0.857% of its base value. Very long-term the existence of a tail emission may have a significant effect on the distribution of a cryptocurrency's circulating supply. Due to the slight inflation holders are also motivated to use the cryptocurrency as a medium of exchange. Additionally, holders have to continuously increase their holdings if they aim to hold a certain ratio of the circulating supply. However, these effects are minor in the short- to mid-term because the tail emission rates of Safex Cash and Monero resemble rather low percentages of the circulating supply after the regular emission schedules.
Conclusion
If the aim of a decentralized cryptocurrency is wide distribution of circulating supply and mining power, the emission schedule should follow the adoption of the cryptocurrency. The majority of Bitcoin's and Litecoin's maximum supply is already in circulation due to their emission schedule and age. Furthermore, they are favorably mined by ASIC miner facilities which represents a barrier for mainstream profitable mining.
Monero has a CPU favorable mining algorithm like Safex Cash which helps mainstream to mine profitable with a home CPU, yet the vast majority of supply is already in circulation due to the blockchain age and emission schedule of ever decreasing block rewards since the genesis block.
In this comparison, only Safex Cash promotes distribution of the currency and also mining power very well. The CPU favorable algorithm ensures that the majority of mainstream will be able to profitably mine SFX with a home CPU setup. Furthermore, the emission schedule is designed having the diffusion of innovation theory in mind and aims to align the distribution of currency with its adoption rate in the future.
References:
[1] Safex (Blue Paper) A peer-to-peer marketplace and fungible digital cash system; Daniel Dabek, Ivana Todorovic; January 3, 2018. (https://safex.io/wp-content/uploads/SafexBluePaperJan3.pdf)
[2] Diffusion of Innovation Theory; Wayne W. LaMorte; September 9, 2019. (https://sphweb.bumc.bu.edu/otlt/MPH-Modules/SB/BehavioralChangeTheories/BehavioralChangeTheories4.html)
[3] Bottlenecks: Aligning UX Design with User Psychology; David Evans; March 5th, 2017. (https://www.researchgate.net/publication/313796154_Bottlenecks_Aligning_UX_Design_with_User_Psychology)